CSS Statistics Past Paper 2023
PART-II (Subjective) 80 Marks
Attempt ONLY FOUR Questions from PART-II by selecting TWO questions from EACH SECTION. (20×4)
PART-II
SECTION – A
Q.2
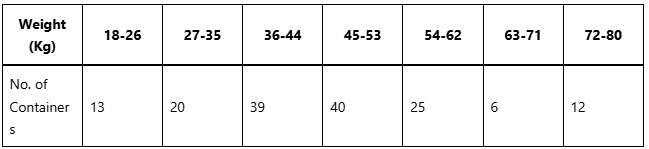
(A) Calculate the Q1, median, and Q3 from the following distribution of the weight of containers in Kg and comment on the symmetry of the distribution.
(B) What is frequency distribution? Discuss briefly the steps involved in the construction of a frequency distribution.
(C) The first three moments of a distribution about the value 2 of the variable are 1, 16, and -40. Show that the mean is 3, the variance is 15, and m3 is -86. Also, show that the first three moments about x=0 are 3, 24, and 76.
Q.3
(A) From the following data, determine the linear regression equations of X1 on X3 and of X2 on X3.
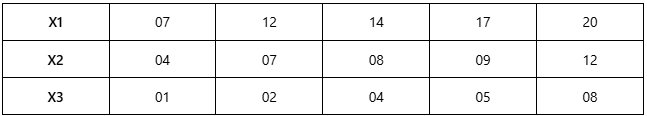
Find the deviations of observed values of X1 from the regression, i.e., X1.3. Repeat the same for X2, i.e., obtain X2.3. Determine the simple correlation coefficient between the two sets of deviations X1.3 and X2.3.
(B) What is meant by:
(i) Regression
(ii) Regresand
(iii) Regressor
(iv) Regressor coefficient
(C) Describe the properties of the correlation coefficient.
Q.4
(A) Derive the Poisson distribution as the limiting form of the binomial distribution, stating clearly the assumptions you make.
(B) Enumerate all the possible (i) combinations and (ii) permutations of 3 letters chosen from the four letters A, B, C, and D.
(C) A box contains 4 bad and 6 good tubes. Two tubes are drawn together at random. One of them is tested and found to be good. What is the probability that the other one is good?
SECTION – B
Q.5
(A) Draw all possible random samples of size n1=2 with replacement from a finite population consisting of 4, 6, 8. Similarly, draw all possible random samples of n2=2 with replacement from another finite population consisting of 1, 2, 3.
(i) Find the possible differences between the sample means of the two populations.
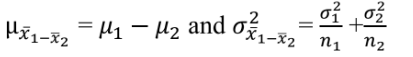
(ii) Construct the sampling distributions of x̅1 − x̅2 and compute its mean and variance.
(iii) Verify that
(B) Explain sampling and non-sampling errors. What methods would you suggest to control each type of error?
Q.6
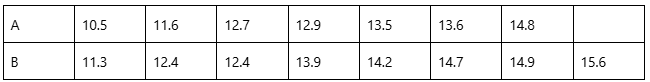
(A) The two samples A and B detailed below were taken from normal populations of standard deviation 0.8. Test whether the difference of means is significant.
(B) Explain with examples the difference between:
(i) Null and alternative hypothesis
(ii) Simple and composite hypothesis
(iii) Type I-error and Type II-error
(iv) Critical and non-critical regions
Q.7
(A) The following data represent the result of 3 questions obtained by 3 students in three subjects:
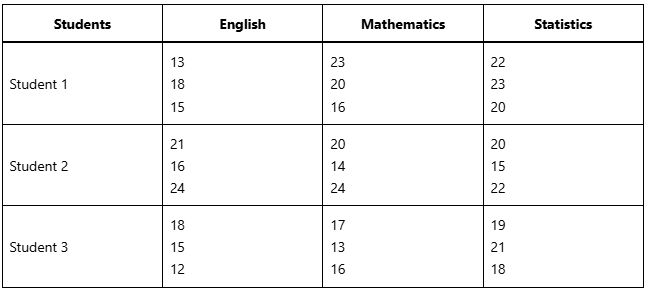
Perform an analysis of variance on these data and test the hypothesis that:
(i) The subjects are of equal difficulty.
(ii) The students are of equal ability.
(iii) The students and subjects do not interact.
(B) Discuss why using multiple two-sample t-tests is not an appropriate alternative to analysis of variance.
Q.8
(A) Given the population 1, 1, 1, 3, 4, 5, 6, 6, 6, and 7, find:
(i) The probability that a random sample of size 36 selected with replacement will yield a sample mean between 3.26 and 4.74.
(ii) The mean and standard deviation for the sampling distribution of means for a sample size of 4 selected at random without replacement. Between what values would you expect at least 3/4 of the sample means to fall?
(B) Explain sampling and non-sampling errors. What methods would you suggest to control each type of error?
(C) Explain with examples the following properties of a point estimator:
(i) Unbiasedness
(ii) Consistency
(iii) Efficiency