CSS Statistics Past Paper 2018
PART-II (Subjective) 80 Marks
Attempt ONLY FOUR Questions from PART-II by selecting TWO questions from EACH SECTION. (20×4)
PART-II
SECTION – A
Q. 2. (a) The mean and standard deviation of a sample of 20 observations were found to be 75 and 2.5, respectively. Upon reviewing the data, it was discovered that one observation, which was actually 68, had been incorrectly recorded as 86. Calculate the correct mean and standard deviation.
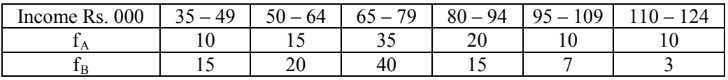
(b) Given below is the distribution of monthly income (to the nearest rupee) of 100 employees working in each of two banks A and B. Compare the variations in salaries of employees by calculating coefficient of variation in each case?
(c) What can you say of the skewness in each of the following cases?
(i) Mean = Rs. 39,000 and Mode = Rs. 45,000
(ii) Median = Rs. 79,390, which the two quartiles are 50.25 and 95.00.
(iii) Mean = Rs. 39,000 and Median = Rs. 38,500
Q. 3. (a) A box contains 12 red and 20 white rose flowers. Flowers are picked randomly without replacement. Find the probability of the following events:
(i) The third flower picked is red, given the first two flowers picked are white?
(ii) Three red and two white flowers are picked in the first five picks?
(b)Two hundred and fifty passengers have made reservations for an airplane flight. If the probability that a passenger who has a reservation will not show up is 0.005, what is the probability that exactly five will not show up?
(c) A soft drink machine is regulated so that it discharges an average of 250 milliliters per glass. If the amount of drink is normally distributed with a standard deviation equal to 15 millimeters, then:
(i) What fraction of the glasses will contain more than 280 milliliters?
(ii) What is the probability that a glass contains between 240 milliliters to 260 milliliters.
Q. 4. (a) What is multiple regression? Explain the basic differences between simple and multiple regression.
(b) Differentiate between multiple correlation and partial correlation.
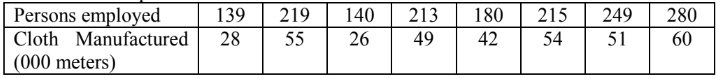
(c) Find the coefficient of correlation between persons employed and cloth manufactured in a textile mill. Interpret the result.
SECTION – B
Q. 5.(a) What is meant by an experimental design? Describe in brief the basic principles of experimental designs.
(b) A consumer agency wanted to find out if the mean time it takes for each of three brands of medicines to provide relief from a headache is the same. The 1st drug was administrated to six randomly selected patients, the 2nd to four randomly selected patients and the 3rd to five randomly selected patients. The following table gives the time (in minutes) taken by each patient to get relief from a headache after taking the medicine.
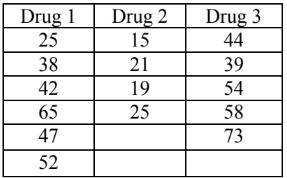
At a 5% significance level, will you conclude that the mean time taken to provide relief differs across the three drugs?
Q. 6. (a) The management of a supermarket wants to find if the preference for local versus imported brands differs by gender. A sample of 900 male shoppers revealed that 400 prefer local brands, and a sample of 1,200 female shoppers revealed that 420 prefer local brands. Answer the following questions:
(i) Construct a 99% confidence interval for the difference between the two proportions.
(ii) At a 5% significance level, can you conclude that the difference in preference is less for male customers than for female customers?
(b) An auto manufacturing company wants to estimate the variance of kilometers per litre for its one of the auto model. A random sample of 25 cars of this model showed that the variance of kilometres per litre for all such cars are approximately normal. Test at the 5% significance level whether the sample result indicates that the population variance is different from 1.05.
(c) A researcher wanted to study the relationship between gender and owning expensive cell phones. A sample of 1000 young people were taken and information given are in the following table.
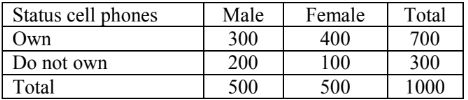
At the 5% level of significance, can we conclude that gender and owning an expensive cell phone are related for all young people?
Q. 7. (a) Define and distinguish between the following pairs:
(i) Target and Sampled Populations
(ii) Simple Random Sampling and Stratified Random Sampling
(iii) Sample Distribution and Sampling Distribution
(b) Explain with examples the properties of a good point estimator.
(c) The heights of a large number of shrubs of the same kind produced for sale by a horticultural nursery are normally distributed with mean 1.14 m and standard deviation 0.25 m. Fifty samples, each consisting of 100 shrubs are selected. In how many of these samples would you expect to have the mean sample being to be (i) greater than 1.16 m; (ii) between 1.13 m and 1.18 m?
Q. 8. (a) What are the various statistical organizations in Pakistan? Discuss the main functions of Statistics Division and NADRA.
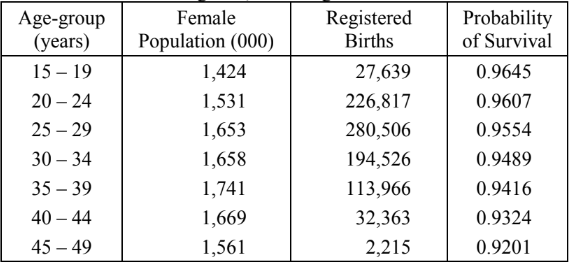
(b) Calculate age-specific fertility rates, total fertility rate, gross-reproduction rate and net reproduction rate from the following data, assuming sex-ratio at birth to be 106.18 per cent