CSS Statistics Past Paper 2020
PART-II (Subjective) 80 Marks
Attempt ONLY FOUR Questions from PART-II by selecting TWO questions from EACH SECTION. (20×4)
PART-II
SECTION – A
Q.2.
(a) Two bags A and B contain red and blue marbles. Bag A contains 7 red and 8 blue marbles. Bag B contains 9 red and 7 blue marbles. One bag is selected randomly, and one marble is drawn. If the drawn marble is red, what is the probability that this marble is from bag A?
(b) For the given observations showing weekly sales of a specific type of refrigerators:
35, 56, 43, 21, 43, 56, 78, 12, 56, 47, 76, 23, 52
(i) Find the mean and standard deviation.
(ii) Find and describe 𝑥̄ ± 2(sd).
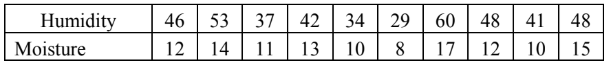
Q.3. Raw material used in the production of synthetic fiber is stored in a place with no humidity control. Measurements of the relative humidity (y) and moisture control (x) on ten days are given below. Fit a Least Squares model:
y=β1+β2𝑥. Further, find and explain the coefficient of determination.
Q.4. Three teaching methods were implemented to a homogenous group of school-level students. Groups of students were selected randomly, taught with a particular method, and their scores were recorded as given below:
Method A 94, 88, 91, 74, 87, 97
Method B 85, 82, 79, 84, 61, 72, 80
Method C 89, 67, 72, 76, 69
Use the Kruskal-Wallis Test at a 5% level of significance to test the hypothesis that, on average, there is no significant difference between the average scores of these teaching methods.
SECTION – B
Q.5.
(a) Draw all possible samples of size 3, without replacement, from the population {6, 12, 3, 9, 15, 21}. Find the sample means and prove the following relationships using usual notations:
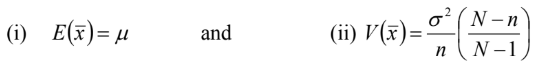
(b) Define the Stratified Random Sampling method. Identify situations where this type of sampling is beneficial. Provide an example.
Q.6.
(a) To compare the effectiveness of two medicines M1 and M2 for headaches, a study was conducted. Samples from a homogenous group of headache patients were selected randomly and administered M1 (six patients) and M2 (eight patients). Recovery times (in minutes) were recorded as follows:

Could it be concluded at a 5% level of significance that, on average, medicine M2 is better than M1?
(b) While testing hypothesis one may commit errors when we make decisions. State and explain such errors, supporting by real life example.
Q.7.
(a) The following Latin Square layout displays the scores secured by nine college students from different ethnic backgrounds and professional interests.
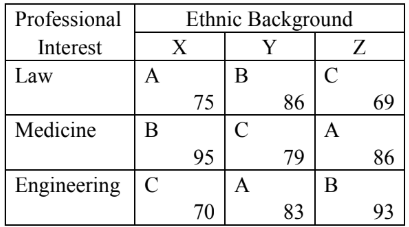
Here, A, B, and C represent three instructors. Analyze and test the following hypotheses using α=0.05:
(i) Having a different instructor has no effect on the scores.
(ii) Differences in ethnic backgrounds have no effect on the scores.
(iii) Differences in professional interest have no effect on the scores.
(b) Describe the role of Multiple Comparison tests in Analysis of Variance. Name a few Multiple Comparison tests and explain one method.
Q.8.
(a) Explain the terms Demography and Vital Statistics. List some sources of demographic data, both locally and globally.
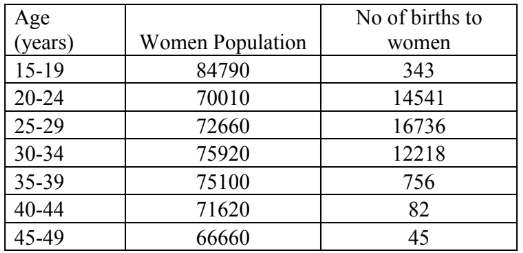
(b) Using the information in the table below, calculate the Total Fertility Rate (TFR) and Gross Fertility Rate (GFR).
(c) Differentiate between Rates and Ratios. Explain Crude Death Rate and Specific Death Rate.