CSS Statistics Past Paper 2021
PART-II (Subjective) 80 Marks
Attempt ONLY FOUR Questions from PART-II by selecting TWO questions from EACH SECTION. (20×4)
PART-II
SECTION – A
Q.2.
(a) Describe the measures of central tendency. What is the purpose served by it? What are its desirable qualities?
(b) A man gets a rise of 10% in salary at the end of his first year of service and further rises of 20% and 25% respectively at the end of second and third years. The rise in each year is calculated on his salary at the beginning of the year. What annual percentage increase is equivalent?
(c) The following has been obtained from two different frequency distributions of weights (lb) having 125 and 200 observations after making the substitution:
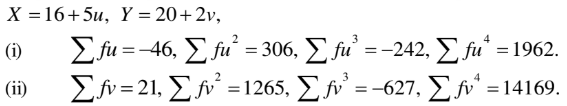
Find:
(i) Which of the distributions is more consistent?
(ii) Which of the distribution is negatively skewed?
(iii) Which of the distribution is mesokurtic?
Q.3.
(a) Describe the linear regression model. Explain the assumptions underlying the linear regression model.
(b) An instructor of mathematics wished to determine the relationship of grades on a final examination to grades on two quizzes given during the semester. Calling X1,X2,X_1, X_2, and X3X_3 the grades of a student on the first quiz, second quiz, and final examination, respectively, he made the following computations for a total of 120 students:

Find:
(i) The least-squares regression equation of X3 on X1 and X2.
(ii) Estimate the final grades of two students who scored respectively (I) 9 and 7, (II) 4 and 8, on the two quizzes.
(iii) Compute R3.12.
(c) Why are non-parametric tests important? Describe the run test in detail and give its advantages and disadvantages.
Q.4.
(a) Describe the random experiment and give its properties. Also, discuss the mutually exclusive events with two real-life examples.
(b) An urn contains four balls that are either:
(i) all white, or
(ii) two white and two black.
A ball is drawn at random and is found to be white. What is the probability that all the balls are white?
(c) Describe the hypergeometric distribution and give its properties. Under what real-life situations can we use it?
SECTION – B
Q.5.
(a) Describe the probability and non-probability sampling methods. Also, differentiate between multiphase and multistage sampling.
(b) A sample of size n=3 is selected using without-replacement sampling from a population having N=5 units whose with values 0, 3, 6, 9, and 12.
(i) Find the sampling distribution of the sample mean (X).
(ii) Calculate the mean and standard deviation of X, and verify that :
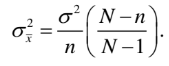
(c) A population consists of 5 observations: 1, 2, 3, 4, and 5. Draw all possible samples of size 2 without replacement. Find the mean of the sampling distribution of the variances. Compare it with the variance of the population.
Q.6.
(a) Differentiate between simple and composite hypotheses. Also, describe the importance of Type-I and Type-II errors.
(b) In a poll of college students at a large state university, 300 of 400 students living in dormitories approved a certain course of action, whereas 200 of 300 students not living in dormitories approved it. Estimate the difference in proportions favoring the course and compare the 95% confidence interval for it.
(c) A manufacturer of house-dresses sent advertising by mail. He sent samples of material to two groups of 1000 women each. For one group, he enclosed a white return envelope, and for the other group, a blue envelope. He received orders of 10% and 30%, respectively. Do the data indicate that the color of the envelope has an effect on sales? Use a 5% level of significance.
Q.7.
(a) Describe the point estimation. Also, discuss the properties of a good point estimator with two real-life examples.
(b) Describe the chi-square test for goodness-of-fit. Also, discuss its procedure for analysis.
(c) The following table shows the number of male and female births in 800 families having 4 children:

Test whether the data is consistent with the hypothesis that the binomial law holds and that the chances of a male birth are equal to that of a female birth i.e. p=q=1/2 .
Q.8.
(a) Describe the importance of vital statistics with its uses and shortcomings.
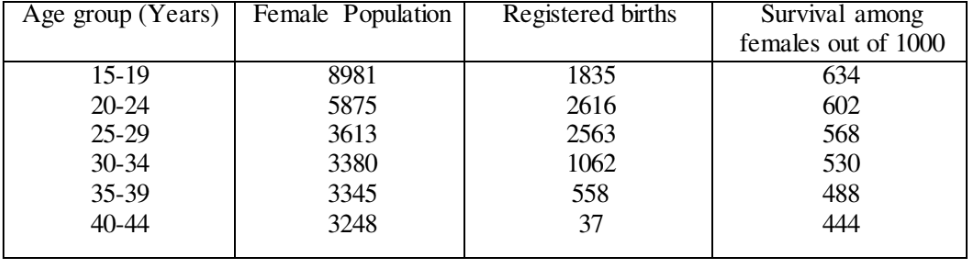
(b) From the following data, find the gross and net reproduction rates by assuming the sex ratio at birth to be 105.2%:
(c) Describe the “National Income,” “Gross Domestic Product,” and “Saving and Wealth” in terms of a country’s economy.