CSS Statistics Past Paper 2022
PART-II (Subjective) 80 Marks
Attempt ONLY FOUR Questions from PART-II by selecting TWO questions from EACH SECTION. (20×4)
PART-II
SECTION – A
Q.2
(a) What can you say of the skewness in each of the following cases:
(i) The median is 60 while the two quartiles are 40 and 80.
(ii) Mean = 140 and Mode = 140.
The first three moments about 16 are respectively -0.35, 2.09, and -1.93.
(b) Discuss the various measures or quantities by which the characteristics of frequency distributions are measured and compared.
(c) Differentiate between descriptive and inferential statistics.
Q.3
The following data give information on the ages (in years) and the number of breakdowns during the past month for a sample of seven machines at a large company:
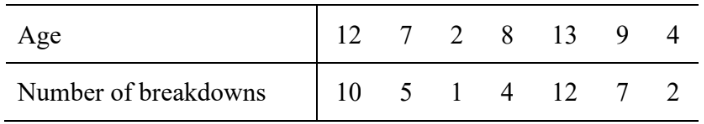
(i) Taking age as the independent variable and the number of breakdowns as the dependent variable, what is your hypothesis about the sign of B in the regression line?
(ii) Compute SSxx, SSyy, and SSxy.
(iii) Find the least squares regression line by choosing the appropriate dependent and independent variables based on your answer in part (i).
(iv) Calculate r and r² and explain what they mean.
(v) Predict the number of breakdowns for age equal to 10 years.
(vi) Compute the standard deviation of errors.
(vii) Construct a 90% confidence interval for B.
(viii) Test the hypothesis: H0 : β=0 against β≠0.
Q.4
(a) A company has 800 employees. Twenty percent of the employees have college degrees, but half of these people are in non-management positions. Thirty percent of the non-degree people are in management positions.
(i) How many managers does the company have?
(ii) What is the conditional probability of being a college graduate who is a manager?
(iii) Find the probability of randomly selecting someone who is either a college graduate or a manager.
(b) A soft drink machine is regulated so that it discharges an average of 200 milliliters per cup. If the amount of drink is normally distributed with a standard deviation equal to 15 millimeters:
(i) What is the probability that a cup contains between 191 and 209 milliliters?
(ii) How many cups will likely overflow if 230 milliliters cups are used for the next 1000 drinks?
(iii) Below what value do we get the smallest 25% of the drinks?
SECTION – B
Q.5
(a) A study of time spent on housework found that men who are employed spend an average of 8.2 hours per week doing housework (Americans’ Use of Time Project, University of Maryland, American Demographics, November 1998). Assume that the amount of time spent on housework per week by all employed men in the United States is normally distributed with a mean of 8.2 hours and a standard deviation of 2.1 hours:
(i) What is the probability that a randomly selected employed man spends 9 or more hours per week on housework?
(ii) What is the probability that a randomly selected employed man spends 7 hours or less on housework per week?
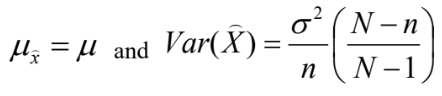
(b) A population consists of N = 6 numbers: 0, 1, 5, 6, 8, and 11. Draw all possible samples of size n=3n = 3, without replacement, from the population and find the sample means. Construct the sampling distribution of sample means and verify that:
Q.6
(a) A candidate for mayor in a large city believes that he appeals to more women voters than men voters. He hires the services of a poll-taking organization, and they find that 62 out of 100 women interviewed support the candidate, and 69 out of 150 men support him.
Calculate the 99% confidence interval for the difference between two proportions.
(b) Explain the six steps of hypothesis testing.
Q.7
(a) Given the following ANOVA for an RCB design:
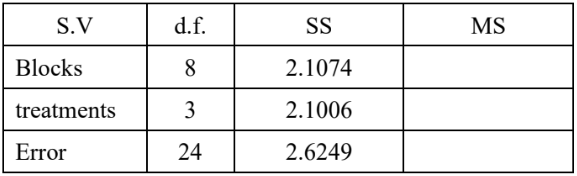
(i) Complete the analysis and fill in the missing mean squares.
(ii) Compute the standard error for a treatment and for the difference between two treatment means.
(iii) Treatment means are 1.464, 1.195, 1.325, and 1.662. What mean or means do you suspect might represent a different population by applying the LSD test?
(b) Define relative efficiency. How would you calculate the relative efficiency of an LS design relative to an RCB design with rows as blocks?
Q.8
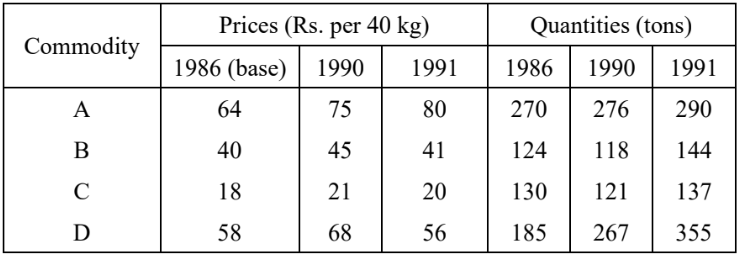
(a) Construct the following weighted aggregative price index numbers for 1990 and 1991 from the given data:
(i) Laspeyres’ index.
(ii) Paasche’s index.
(iii) Fisher’s “Ideal” index.
(b) Describe the importance of vital statistics. Also, state its uses and limitations.